Non-parametric tools to compare two populations.
Pretty often you are looking at two data sets and wonder “if I use treatment B should I expect similar results than the ones obtained when using treatment A”. Next step, of course, you plot the data, pour yourself a cup of coffee and stare at the graphs from different angles. Unfortunately, they look oddly shaped and nothing seems to be wrong with the data collection. At this point, you uncross your fingers (crossed every time you expect the data to look Normal) and blame your bad luck. It might be one of those weird distributions that make everything more complicated.
The data could look like this: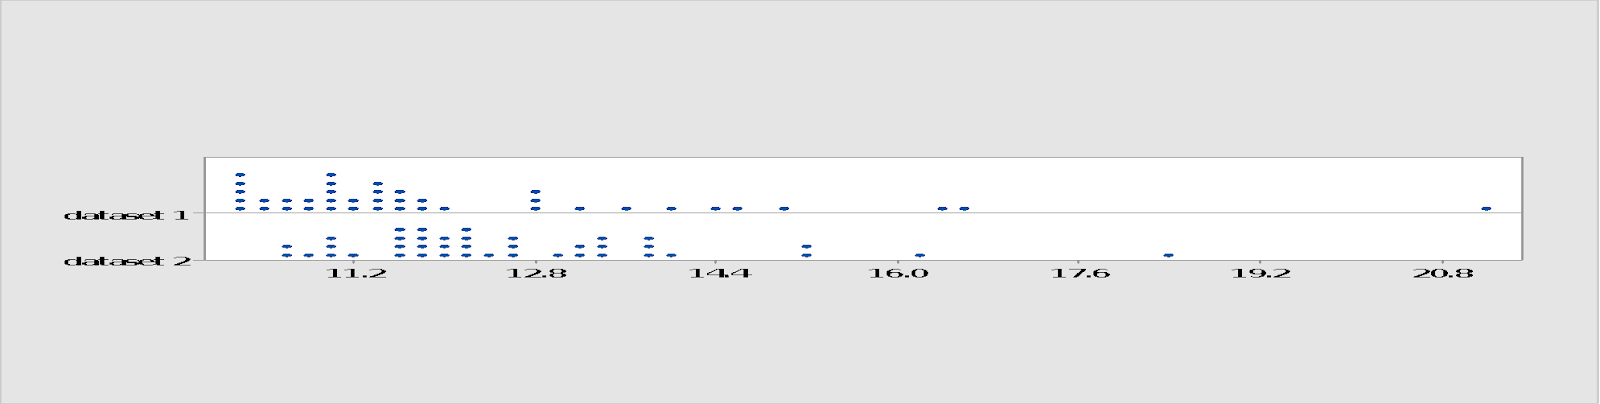
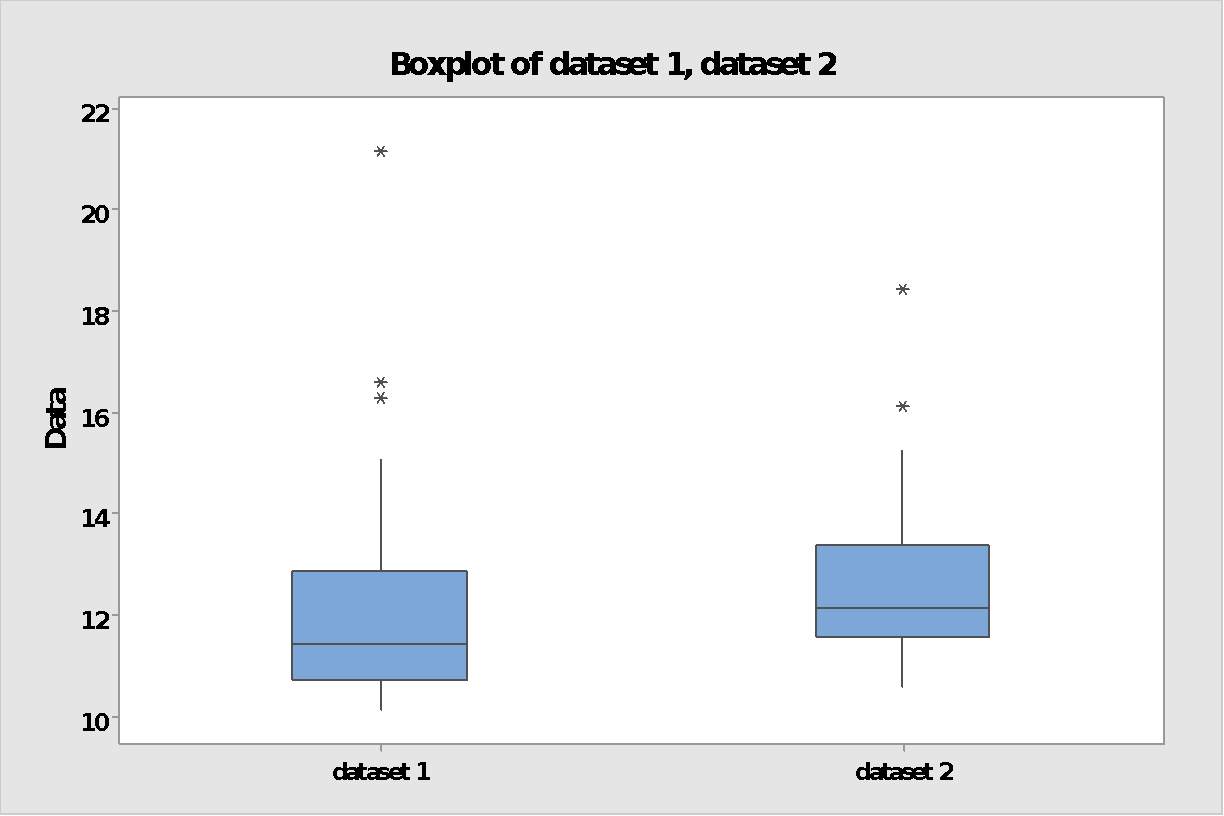
Before you had look at the data you were thinking of performing the good old two sample t-test and be done with it. Now there are some doubts. If you look at the graph there seems to be a greater concentration of points on the lower end of dataset 1 but also one value lying higher than dataset 2; intuitively you would tend to expect a higher value from dataset 2 but is that statistically significant?
You know that t-test uses an assumption of normality (actually T-student distribution which resembles normality in a “cautious” way) but also heard that is not absolutely necessary: for the most part, deviation from normality should not be that risky . So you go ahead and perform the test and the results come out like this:
Two-Sample T-Test and CI: dataset 1, dataset 2
Two-sample T for dataset 1 vs dataset 2
N Mean StDev SE Mean
dataset 1 40 12.13 2.21 0.35
dataset 2 40 12.61 1.59 0.25
Difference = μ (dataset 1) - μ (dataset 2)
Estimate for difference: -0.482
95% CI for difference: (-1.341, 0.376)
T-Test of difference = 0 (vs ≠): T-Value = -1.12 P-Value = 0.266 DF = 70
Based on those results you can conclude that both data sets came from the same population and thus treatment A is not different from treatment B. And that would be a wrong conclusion (you kind of saw that coming didn’t you?). One reason is that because of the skewness of the data sets, Mean or average is not the best statistic to measure central tendency. The use of Median seems to be better in this case. Another reason is that t-test is not too sensitive to deviations from normality but in this case that deviation is fairly high. The non-parametric way seems to be an option!
Three tools come to mind: Mann-Whitney; Kruskal-Wallis; Mood’s median test (statistician love putting their last names on everything).
Mann-Whitney Test and CI: dataset 1, dataset 2
N Median
dataset 1 40 11.443
dataset 2 40 12.143
Point estimate for η1 - η2 is -0.716
95.1 Percent CI for η1 - η2 is (-1.293,-0.179)
W = 1357.0
Test of η1 = η2 vs η1 ≠ η2 is significant at 0.0115
Kruskal-Wallis Test: C5 versus C4
Kruskal-Wallis Test on C5
C4 N Median Ave Rank Z
dataset 1 40 11.44 33.9 -2.53
dataset 2 40 12.14 47.1 2.53
Overall 80 40.5
H = 6.40 DF = 1 P = 0.011
Mood Median Test: C5 versus C4
Mood median test for C5
Chi-Square = 9.80 DF = 1 P = 0.002
Individual 95.0% CIs
C4 N≤ N> Median Q3-Q1 -------+---------+---------+---------
dataset 1 27 13 11.44 2.11 (-------*---)
dataset 2 13 27 12.14 1.80 (----*-----------)
-------+---------+---------+---------
11.40 12.00 12.60
Overall median = 11.75
A 95.0% CI for median(dataset 1) - median(dataset 2): (-1.54,-0.28)
In conclusion, in this example, the two data sets were in fact statistically different (that doesn’t mean they are practically different) so when distributions look crooked be careful with a t-test. Non-parametric analyses have a scary name but they actually are as simple as the parametric version (if not simpler).
By the way, the data did came from a distribution (Gamma) generated and analyzed with Minitab™ software (as you can obviously see).
No comments:
Post a Comment